The 8-month vision sprint, in one flow
From a Booking-confirmed screen to a four-year roadmap. 8 months. 27 stakeholders. 16 ideas, 4 shipped, 12 queued by dependency.
- M · 01 The gap No horizontal cross-functional forum. Booking left behind by KLM, Trip.com, Vueling on post-book. Confirmation page was a thank-you screen.
- M · 02 The 30× gap Pulled with Xijia: <2k post-book vs 64k pre-book visitors. Reframed as an experience-architecture problem, not a UX one.
- M · 03 The stopped test Fast Track moved top-of-details: visibility up, sales flat, baggage hurt. Killed. Surface ≠ placement.
- M · 04 The workshop 13–14 Nov 2024. 27 stakeholders, ELT to junior PMs. Two days. Most senior cross-functional table post-book had ever seen.
- M · 05 The horizon split Visibility first; personalisation deferred to 2026. Cost 3 weeks of credibility. You can't personalise a surface that doesn't exist.
- M · 06 The architecture 10 concepts → 3 layers (entry · surface · unify) across 5 surfaces. Drawn as a system, not a list.
- M · 07 Usability flipped it 7 iterations, 16 participants. Tabs failed. Carousel won every round. Discovery, not desire.
- M · 08 4 of 16 shipped Order Details · email · My Trips · cart pattern, all live H2 2025. 12 queued on dependencies (ML, BTG, platform, supplier, CCJ).
01 / The gap Falling behind on post-book
Booking.com Flights was shipping ancillary improvements quickly. Fast Track in 2024. Seat selection. Lounge access. Baggage upgrades. Each track moved fast on its own.
On the post-book surface specifically, Booking.com Flights was being left behind. KLM was selling bundles. Trip.com was nudging customers with "put the final touches on your trip." Vueling, Turkish Airlines, Kiwi, BA had structured email upsells.
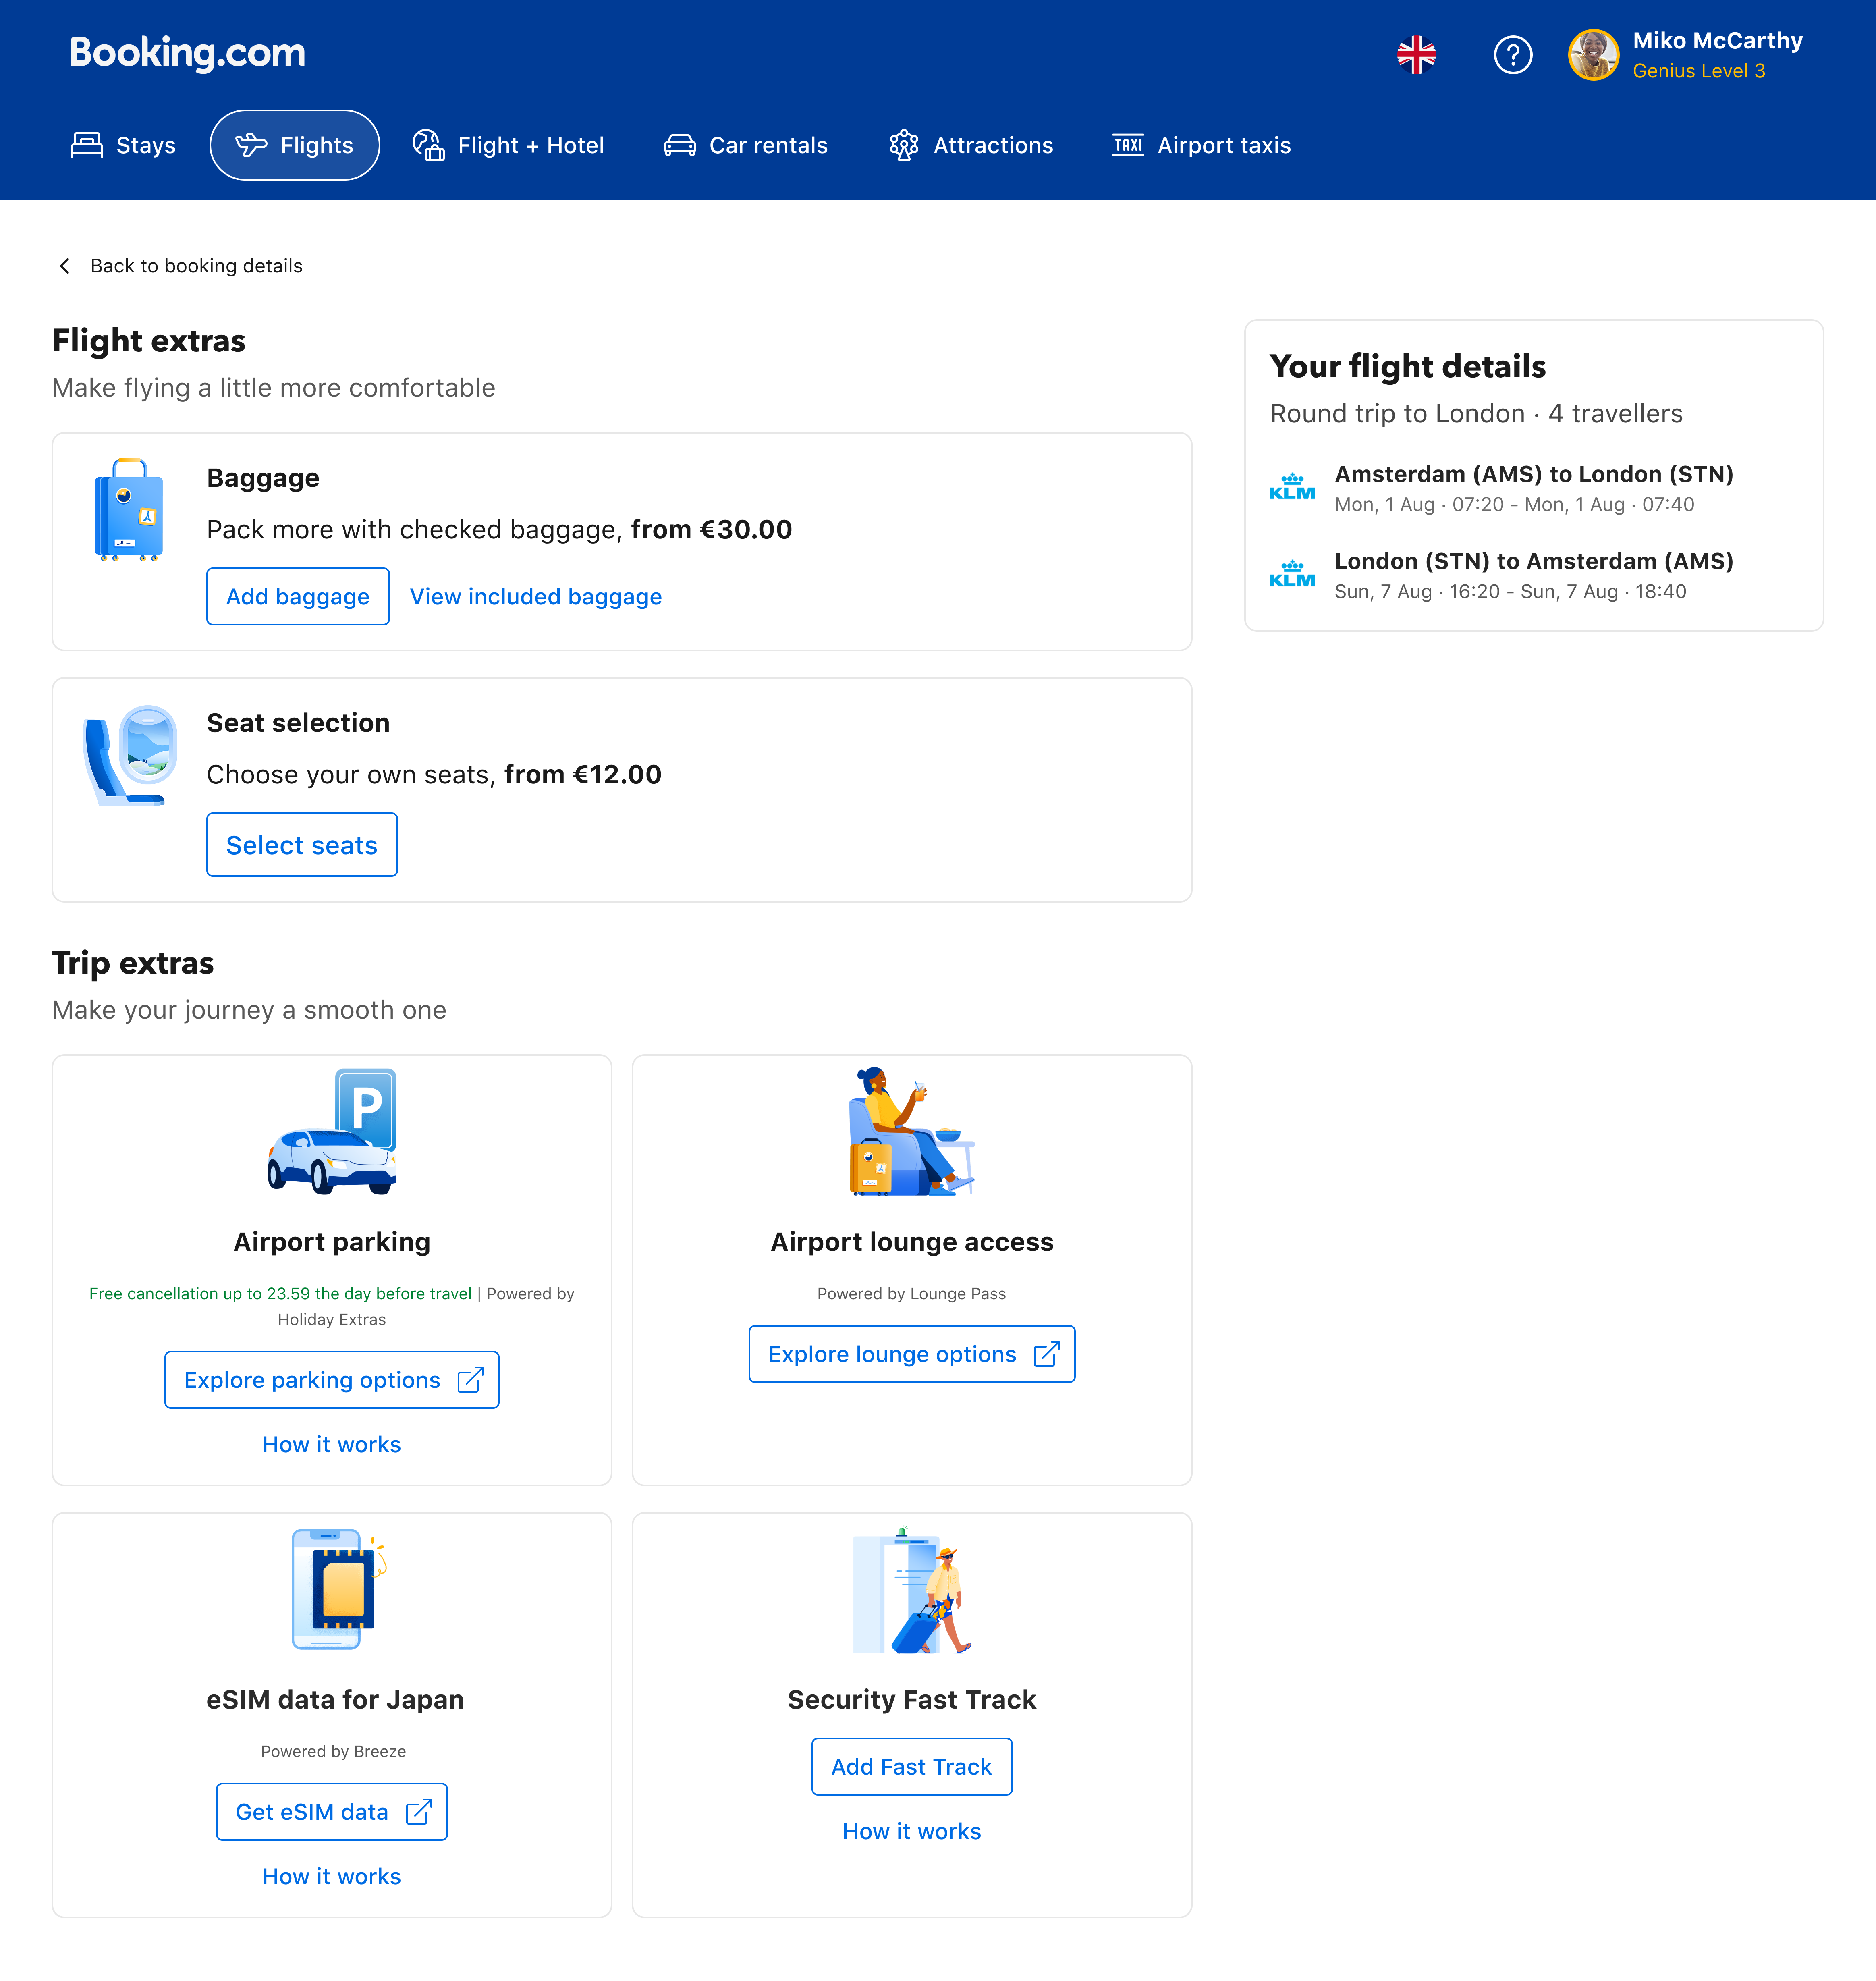
Booking.com's post-confirmation page was a thank-you screen. Without a vision, the risk was watching the gap with competitors widen one quarter at a time.
That gap was the seed for this work. The Traveller Experience Review series was the forum. The Post Book Ancillaries Vision was the first track-level deep dive that came out of it.
02 / The data told the story Post-book ancillaries served <2,000 customers. Pre-book served 64,000. The ceiling was the experience itself.
Before the workshop, Xijia and I pulled the post-booking ancillary numbers. The picture was stark, and it confirmed what customer-service tickets had been hinting at for months: customers wanted to add ancillaries after booking, and the surface for them to do so didn't exist.
The conversion side of the ledger was just as lopsided. Fast Track on pre-book was offered to ~29% of visitors and converted at ~0.9%. On post-book, it was offered to ~32% but converted at 0.13%. Roughly 7× lower at roughly 30× smaller scale.
| Surface | Offer rate | Attach rate |
|---|---|---|
| Pre-book funnel | ~29% | ~0.9% |
| Post-book confirmation page experiment | ~32% | 0.13% |
| Post-book co-purchase (Fast Track + baggage) | n/a | 0.02% |
The experiment that proved the surface mattered more than the placement
One running experiment in particular told the story before the workshop even started. The team had moved Fast Track to the top of the post-book flight details page, hypothesising that putting the offer above the fold would lift attach. It didn't. Visibility and clicks improved. Sales did not. Worse, it hurt baggage sales. The experiment was stopped.
Two other Fast Track placements had run in parallel: a first attempt buried in the post-book details page (0.05% attach, no harm), and a confirmation-page placement that lifted attach to 0.13%. Three placements, three different outcomes, none of them good enough.
| Experiment | Result |
|---|---|
| Fast Track in PB flight details page | Attach 0.05%. No harm to other addons. Full on, but not enough. |
| Fast Track on the confirmation page | Attach lifted to 0.13%. Full on. |
| Fast Track at the top of PB flight details | Visibility & clicks improved. No improvement in sales. Hurt baggage sales. Stopped. |
03 / The workshop 27 stakeholders, two days, four focus areas locked.
On 13–14 November 2024, Shubhi (PM), Aditya (supporting PM) and I ran a two-day design workshop. 27 cross-functional participants: Flights LT and ELT, Craft and Track Leads, PMs, GPMs, customer insights, machine learning, BTG and supplier ops, engineering. The most senior cross-functional table the post-book track had ever been brought to.
The goal was to imagine, explore, and generate creative ideas that expand beyond the current solution and technology limitations. Not to redesign a screen. To agree on what the next 4 years of post-book ancillaries should look like.
| Day | Block | Activity |
|---|---|---|
| Day 1, AM | Set context | Background · focus areas · customer insights · experimentation data · competitor analysis |
| Day 1, PM | Ideate, sketch, vote | Brainstorm per focus area · group voting · sketch · storyboard · present · green & red pencil critique |
| Day 2 | Craft | Lead designer crafted ideas explored into vision concepts |
04 / Four focus areas, two horizons The decision that saved the roadmap was telling leadership what we would not do first.
The workshop converged on four focus areas. The bigger decision was placing them on two horizons.
Current horizon
Current horizon
Long-term · 2026–2028
Long-term · 2026–2028
The argument I had to win
This split was the contentious decision of the workshop. The Flights leadership vision for ancillaries had personalization and recommendation as the headline ambitions. Booking.com Flights was being left behind by competitors on post-book, and "ranked, recommended, AI-suggested ancillaries" was the rallying cry that excited the room.
I argued for visibility first, and that argument cost me about three weeks of stakeholder credibility before testing came back to settle it.
You can't personalize a surface that doesn't exist.
The carousel had to be built before an algorithm could rank it. The dedicated page had to exist before a recommendation could point to it. The post-book experience didn't yet have entry points for an ML model to optimize against. Visibility was the prerequisite, not the consolation prize.
Why naming dependencies openly mattered
Personalization and unifying the purchase process were also dependent on ML model investment, BTG decisions, supplier integrations, and platform work that wasn't in 2025's plan. Tagging that dependency openly was what turned a deck into a roadmap. Wish-listing them in the current horizon would have meant promising something we couldn't deliver.
05 / From sketches to a system 10 vision concepts. 3 architectural layers. 5 surfaces in the ecosystem.
I crafted the workshop output into 10 vision concepts, each tied to a focus area, each with rules, explored opportunities, and questions to test. Combined with adjacent backlog items already scoped by the post-book and ACE tracks, the working set going into prioritization was 16 ideas.
From the workshop
Workshop + ACE backlog
Entry · Surface · Unify
Three layers, not ten features
The 10 concepts are not 10 features. They are three connected layers of one architecture: entry points (the surfaces that get customers to the ancillaries page), the dedicated surface itself (where evaluation and decision happen), and unification primitives (the patterns that let customers buy more than one ancillary without re-entering the funnel).
Drawing the concepts as a system, not a list, was what made the long-term horizon legible to leadership.
The vision touches 5 surfaces, not 1
The post-book ancillary experience does not live on a single page. It spans the order details surface on Desktop and Mdot, the apps experience, the email channel (confirmation, booking-reference, check-in), the My Trips page on web and apps, and the push-notification channel. Designing the vision meant designing for that ecosystem, not for one screen.
| # | Concept | Focus area |
|---|---|---|
| 1 | Tab Selector, Segment Control & Carousel | Introducing new ancillaries |
| 2 | Ancillaries Dedicated Page | Introducing new ancillaries |
| 3 | Upgrade Trip below the Flights Summary card | Visibility & engagement |
| 4 | Upsell in confirmation, booking-reference & check-in emails | Visibility & engagement |
| 5 | Post-book Ancillary dedicated page & emails | Personalization & recommendation |
| 6 | Items added to cart from Order Details & Ancillaries page | Unifying the purchase process |
| 7 | Reviewing cart | Unifying the purchase process |
| 8 | Add to cart / Buy Now product info state (hover & click) | Unifying the purchase process |
| 9 | Checkout from Ancillary page | Unifying the purchase process |
| 10 | Purchase checkout from basket & product info | Unifying the purchase process |
06 / Usability findings reordered the priorities 7 iterations, 16 participants, one ranked carousel.
Concepts went into usability testing across 7 iterations with 16 participants, on six dimensions: visibility and discovery, interaction and engagement, interest and intent, clarity, navigation, and preferences.
I was wrong about what would work.
The pattern I expected to win
The tab pattern was my early favorite. Tabs are familiar. Tabs are scannable. Tabs are how every booking system on the internet handles primary content versus secondary content. So the first iteration tested a tab structure: Booking summary on one tab, Available extras on the other.
Participants did not see the tabs. Not "did not click." Did not see. They scrolled past the tab bar, never registered the second tab existed, and described the page as useful without ever mentioning the extras. The same thing happened with segment controls. Banner-style upsells were ignored. The booking-details screen was, in their words, overwhelming, and the upsell furniture was the part their eyes skipped.
The pattern that did
Then we tested a carousel directly under the booking summary card. Image, ancillary name, starting price, an "Add" CTA, a "See all extras" link at the end. No tabs, no segments. Just a horizontally-scrollable strip of the things they could buy.
The carousel won every iteration after it appeared. Real participant words from the test:
- "Carousel drives engagement with illustrations and the 'View all extras' CTA."
- "Carousel most engaging for exploring ancillaries. Banners least effective."
- "Carousel effective. Grabs attention, showcases extras and prices, encourages exploration without clutter."
The "wow" at the page nobody could find
The bigger surprise came at the dedicated extras page. Once participants opened it, the reaction shifted. Two of them said the word "wow" out loud. One asked if Fast Track was something they could still buy after booking. The page itself was not the problem. Getting to it was.
Two follow-up findings reshaped specific surfaces:
| What participants told us | What we changed |
|---|---|
| "What's a digital SIM?" The eSIM copy was too vague. Starting prices were ambiguous (per traveller or for all?). | Rewrote eSIM copy with Natalie. Specified "for international travel" up front. Made per-traveller pricing explicit. |
| "How do I know this is trustworthy? How many other people booked this?" Participants asked for social proof before adding ancillaries. | Trust elements (Trustpilot-style ratings, "X customers added this") were added to the H1 2026 carousel-personalization brief. |
| Confirmation email upsells were missed. Participants were locked on booking-detail comprehension at that moment. | Moved primary email upsell to the check-in email instead. Confirmation email kept a single low-prominence "Upgrade your trip" link. |
07 / Embedding into the roadmap A vision becomes a plan when leadership owns it.
The vision was reviewed in three rounds with progressively senior audiences.
| Review | Audience | Status |
|---|---|---|
| Review 1 | Cross-functional teams, PMs, GPMs, stakeholders | Done |
| Usability test | 16 participants, 7 iterations | Done |
| Review 2 | Flights LT for Traveller Experience Review, 30 April 2025 | Done |
| Review 3 | Flights team UX Review | Done |
| Embed | Q2 2025 roadmap exercise · short-term ideas integrated into team plans | Done |
How we prioritized 16 ideas into a 3-horizon roadmap
By the end of usability testing, we had 16 ideas spread across the four focus areas. The team's roadmap had room for a fraction of that in the next 6 months. The prioritization had to be defensible to engineering, ML, supplier ops, and Flights leadership at the same time. We used four lenses, applied in order.
| Lens | What it filtered for |
|---|---|
| 1. Dependency | Could it ship without new ML, BTG, supplier, platform, or external-party investment? Each idea was tagged with one or more dependencies (CCJ, Platform, Commercial, Operations, ETG, ML, FDE, External party). No new dependency = candidate for H2 2025. |
| 2. Customer evidence | What did the 16 usability participants engage with? Carousel won every iteration. Tabs, segment controls, banners did not. Patterns with no customer evidence dropped down the stack. |
| 3. Strategic order | The four focus areas were ordered: visibility (current) before personalization (long-term). Within visibility, entry points before ranking. Within unification, single-ancillary checkout before bundles. Order followed the architecture, not the appetite. |
| 4. RICE | Reach × Impact × Confidence ÷ Effort, scored on the ACE UX backlog. Used as the tiebreaker when two ideas cleared the first three lenses. |
Applied in that order, the 16 ideas mapped cleanly to three horizons. Visibility entry points cleared all four lenses and went into H2 2025. Carousel ranking and trust elements cleared lenses 2 and 3 but needed ML investment, so they went into H1 2026. Personalization, bundling, and unified checkout depended on ML, BTG, supplier, and platform work that wasn't in the 2025 plan, so they went into 2026–2028.
The three horizons are not arbitrary. They map exactly to the three colors in the E2E flowchart in Ch 05: grey is what existed, green ships in H2 2025, orange waits for 2026–2028. The architecture and the roadmap were drawn on the same canvas because they are the same decision.
| Horizon | Theme | Scope |
|---|---|---|
| H2 2025 | Visualisation & entry points | Ancillaries dedicated page, entry points across order details, confirmation/check-in/booking-ref emails, My Trips, push notifications. Apps/Mdot design parity. |
| H1 2026 | Carousel optimization | Ranking by trip popularity, route-based clicks, ML recommendation, copy experiments, trust elements. |
| 2026–2028 | Personalization & unified purchase | Dynamic ranking, bundling, single-checkout multi-ancillary purchase, supplier-integrated white-label expansion. |
08 / What shipped, what's queued 4 of 16. The ones that needed no new dependency went first.
By the time the H2 2025 horizon closed, four of the sixteen ideas had shipped to production. Looking back at the E2E flowchart in Ch 05: the four shipped surfaces are the green entry points feeding into the central Ancillaries Upsell page. The architecture stayed intact. The colors stayed honest. What was promised in green for H2 2025 is the same thing that shipped.
| # | Shipped | Where |
|---|---|---|
| 1 | Ancillary entry point on Order Details | Post-book confirmed-booking page |
| 2 | Upsell in confirmation, booking-reference & check-in emails | Email channel |
| 3 | "Upgrade your trip with extras" entry on My Trips | Active flight-booking trip detail |
| 4 | Items-added-to-cart pattern from Order Details | Cart unification first step |
The remaining 12 sit on the H1 2026 and 2026–2028 plan, with dependency tags negotiated during roadmap embed.
| Queued for | What unlocks it |
|---|---|
| Carousel ranking and personalization | ML model investment |
| Bundled checkout | Platform & CCJ work |
| Multi-ancillary single-checkout | Cart unification + payments |
| White-label ancillary expansion | BTG & supplier integrations |
| Push-notification entry points | App platform & Operations |
09 / Reflections Most of the work I'm proudest of here is not on the screen.
Three things I'd carry forward from this work.
Orchestration is design, at this level.
Bringing 27 senior stakeholders into a room and getting them to agree on a 4-year horizon is not soft work. The agenda, the pre-reads, the green and red pencil critique format, the way the focus areas were split: that was where the leverage was. Sketches are downstream of getting the room right.
The honest split is the unlock.
Telling leadership "we will not personalize ancillaries until 2026" was the move that protected the 2025 plan. A vision that hides its own dependencies is a wishlist. Tagging long-term work as long-term, with the dependency named, is what turns a deck into a roadmap.
Data anchored the bet.
64,000 vs <2,000 is not a UX argument. It is a product-strategy argument with a UX answer. Pulling that number with Xijia before the workshop, and putting it in the first 60 seconds of every leadership review, was the difference between a deck that gets nodded at and one that gets resourced.
The agenda for day one is not in this case study. Neither is the vote matrix, or the three-week argument over horizons. The screens are the artifact. The argument is the work.